Garage NovaLynx Shelter Temp value indicates too high in the sunlight. An extra shield and twin squirrel cage mini-fans have been added to exhaust the enclosure. Hopefully this will improve the accuracy during direct sunlight exposure.
Calculated Data
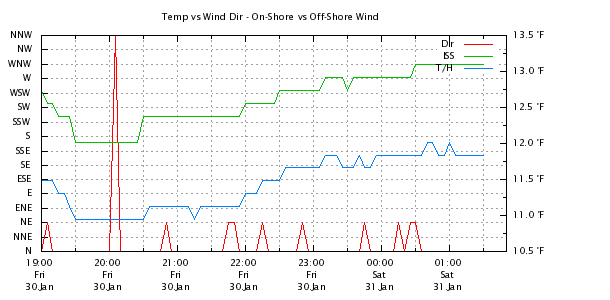
Temperature vs wind direction for onshore breeze.
Plot of Davis ISS and Temp/Hum Station versus Wind Direction. The shift to onshore (or offshore) breeze can be seen in the direction plot versus temperatures. A drop in temperature can be seen when the wind shifts to a direction coming off the lake, mostly Easterly. The preceding six hours are plotted. The left axis is compass degrees, the right axis is temperature in degrees F.
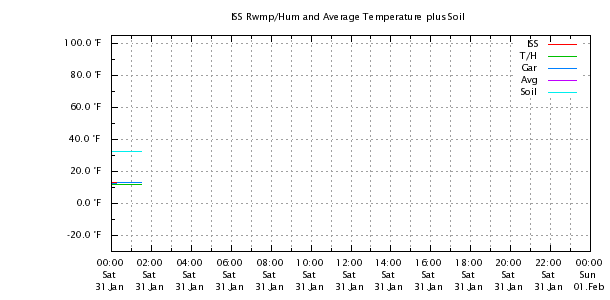
Plot of the various sensors Between Davis ISS in °F. Garage Shelter Temp plot trends high in the sunlight.
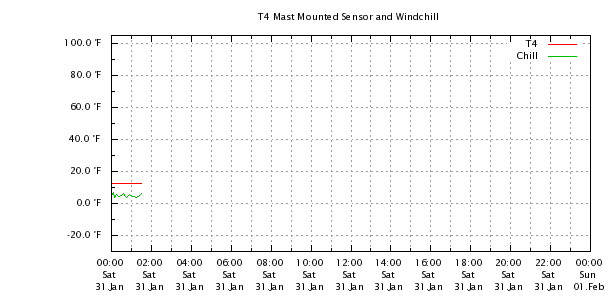
Plot of the Sensor T4 mounted on Anemometer mast and Windchill in °F. Sensor T4 is connected to the RM Young Anemometer transmitter in order to provide windchill data. This plot shows the T4 measured temperature versus calculated Windchill. This may vary from the calculated Windchill displayed on the main site, which is derived from the Davis Envoy.
Indoor vs. Outdoor
Plot of the Difference Between Davis ISS and Indoor Temp in °F at Envoy8x. (ISS-Inside)
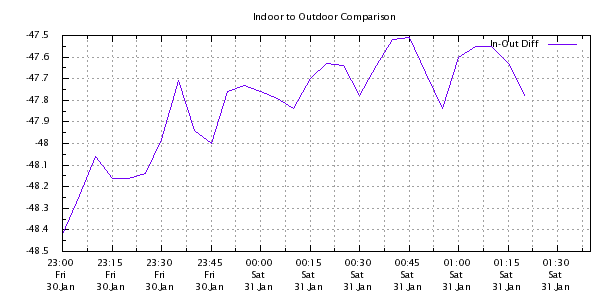
Charts via Meteohub and Envoy8x. Uploaded by Meteohub.

